AB InBev GRA — Marketing Budget Allocation Platform
Enterprise Product Design · UX/UI · Data Visualisation
Business problem
How do you measure the real ROI of marketing spend — and use it to allocate next year's budget with confidence?
AB InBev allocates marketing budgets across 16+ brands in every country it operates in — Budweiser, Corona, Stella Artois, Modelo, Cass, Jupiler and more.
Every market reported differently. GHQ directors chased executives country by country, then manually reshaped the data before any comparison was possible.
No shared source of truth. Market managers couldn't evidence past performance to justify next year's ask; leadership couldn't validate whether a plan matched forecast numbers.
Constraints lived everywhere. Fixed contracts, soft and hard limits, big bets from the top, key initiatives from the ground — none of it visible in one place.
The ask: One platform usable by global executives and local marketers alike, regardless of geography, hierarchy or data fluency.
Design impact
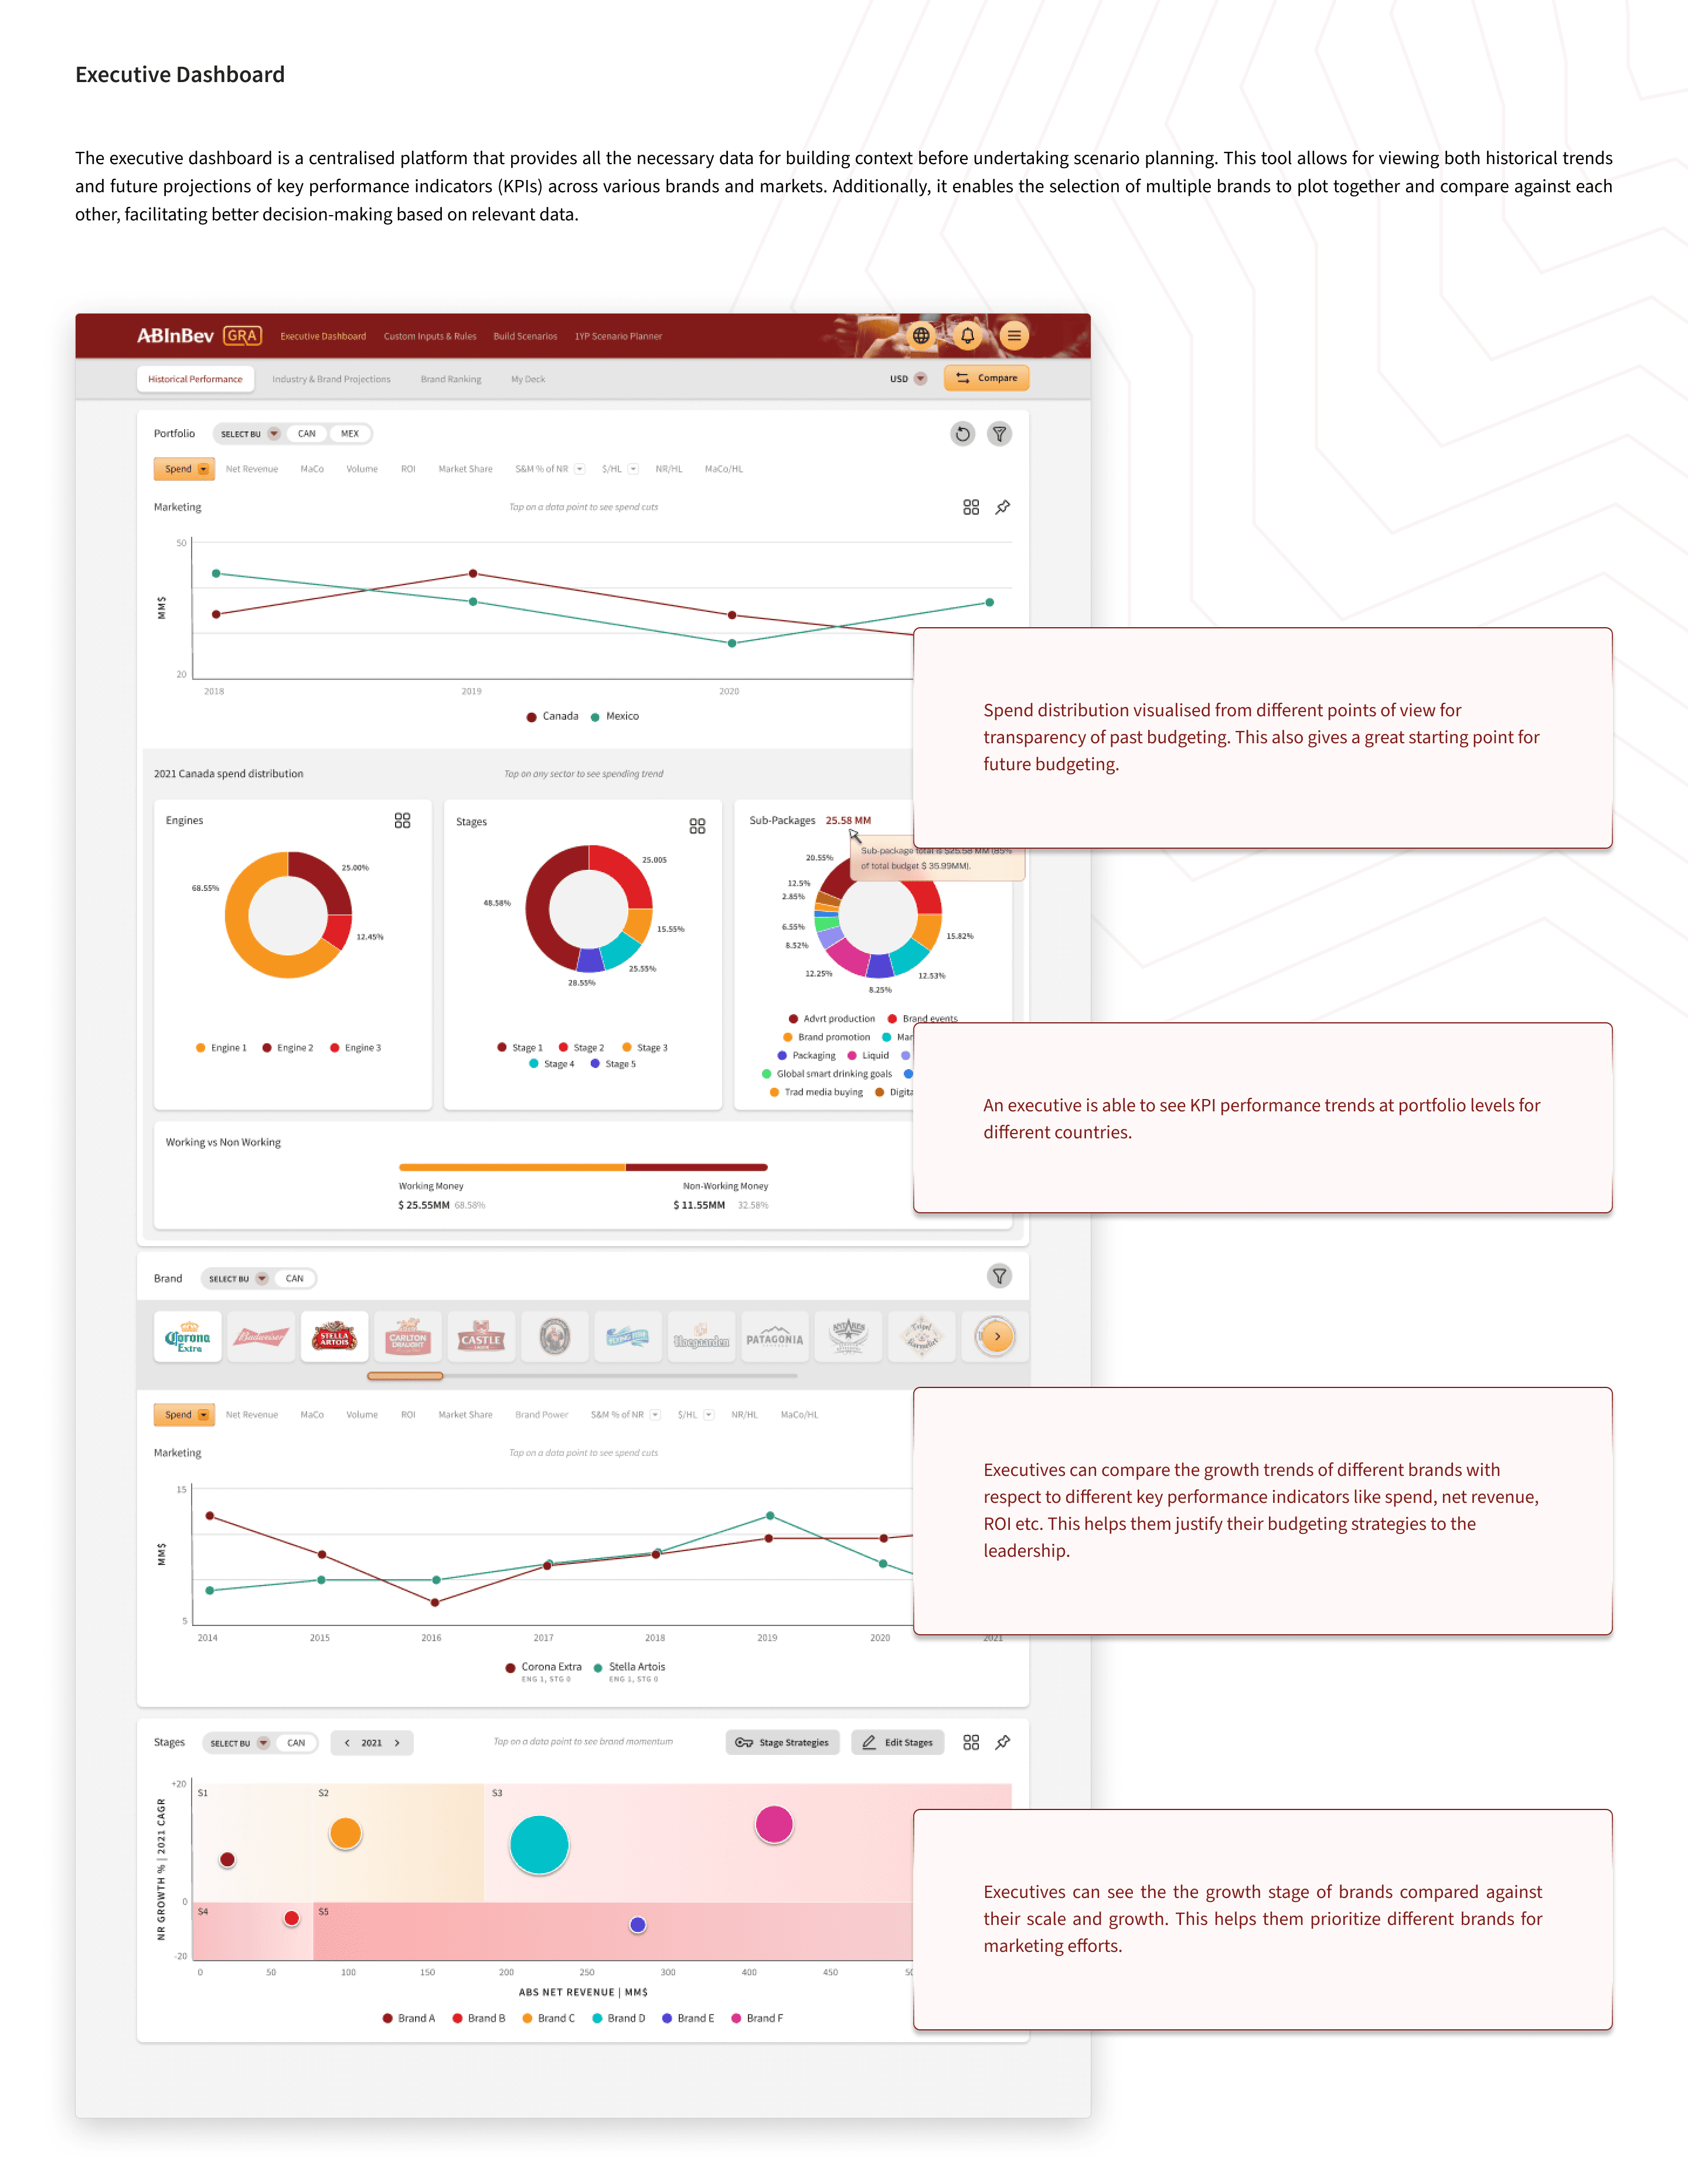
One language for performance. Standardised spend, net revenue and ROI views across markets — cross-country comparison went from a manual exercise to a filter.
Context before commitment. An executive dashboard that plots historical trends and forward projections for any brand or market combination, so planning starts from evidence.
Engines: a brand benchmarking model. Brands categorised by pricing, brand power and market share — giving teams a defensible way to prioritise where money goes.
Scenario planning, not spreadsheets. Executives model higher and lower budget cases, layer in constraints, and compare scenarios side by side before committing.
Weighted allocation, made visible. Custom weights on marketing drivers through an intuitive engine — precision without needing to read the algorithm.
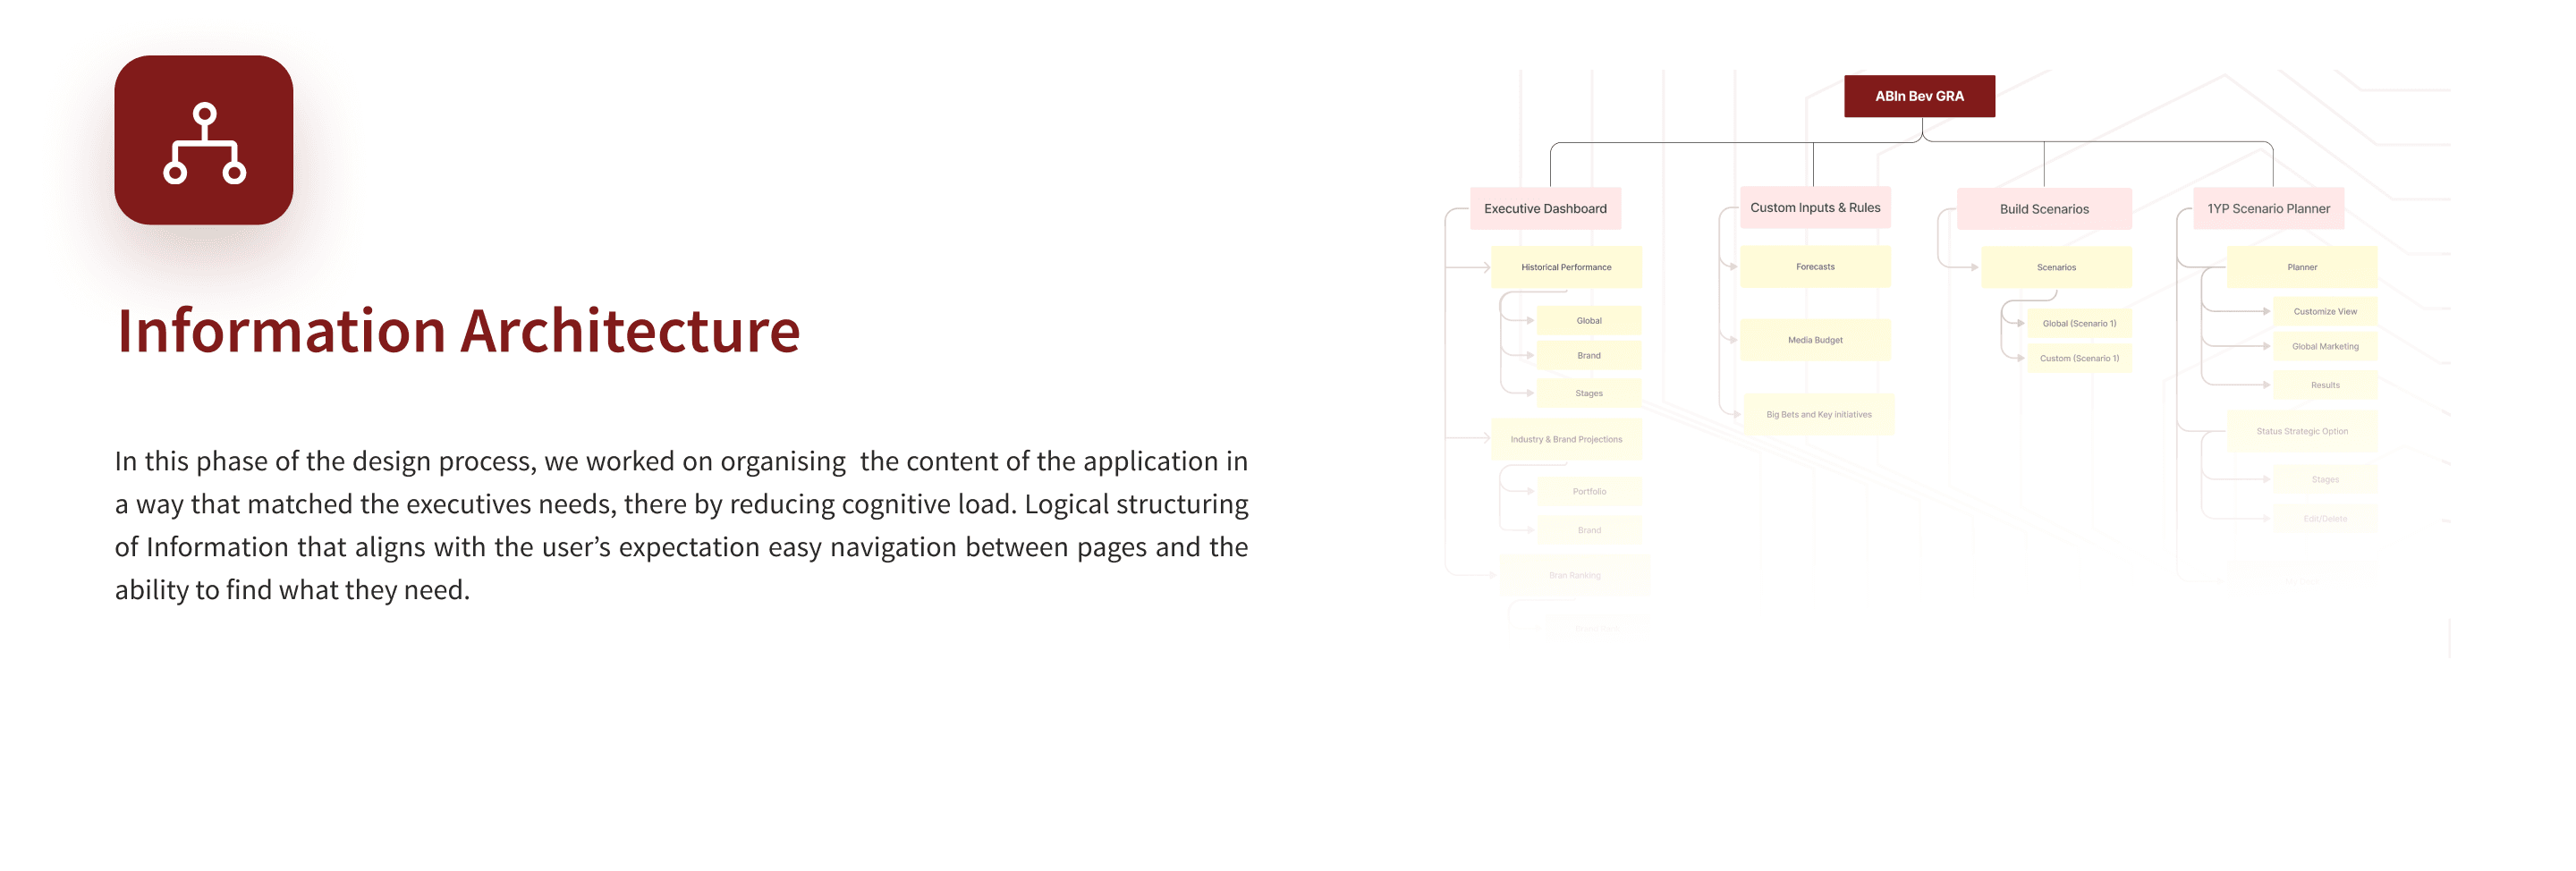
Cognitive load down, confidence up. Information architecture built from co-design workshops with the AB InBev product team, structured to match how executives actually think about budgets.
From reporting tool to decision tool. Teams stopped assembling reports and started arguing about strategy with the same numbers on screen.